Running
Head: META-ANALYSIS JUDGMENTS
On using meta-analysis to make judgments about
validity generalization
Michael A. Gillespie
Frederick L. Oswald
and
Patrick D. Converse
Michigan State University
Presented in S. Morris (Chair), Rethinking Artifact Corrections in Meta-Analysis: Innovations and Extensions. Symposium conducted at the 17th Annual Convention of the Society for Industrial and Organizational Psychology, Toronto, CN.
Correspondence concerning this article should be directed to Michael Gillespie, Department of Psychology, Michigan State University, 129 Psychology Research Building, East Lansing, MI 48824-1117; e-mail: gilles54@msu.edu.
Abstract
The number of published
meta-analyses continues to increase, and people use them to inform decisions in
research, practice, and policy. This
study investigates the use of two popular meta-analytic methods within the
Hunter and Schmidt (1990) approach: what we refer to as the artifact distribution and the
individual correction methods. We compare these two methods based on the
extent to which the estimates they provide really reflect the true values of
population variance. In conducting a
Monte Carlo simulation, we found that both methods exhibit systematic bias, and
that the two drastically differ in the variability of obtained population
variance estimates. We conclude that
caution should be exercised when making validity generalization conclusions on
the basis of these methods, particularly when using the artifact distribution
method.
On using meta-analysis to make judgments about
validity generalization
In applied psychology, meta-analysis has become an increasingly popular method for quantitatively integrating research findings across studies investigating similar phenomena. The past 25 years has shown an unabated increase in the number of published meta-analyses in psychology (Oswald & McCloy, in press), and therefore it is increasingly important to understand what the findings from meta-analysis provide researchers and practitioners. At its very essence, a meta-analysis simply estimates a mean and variance of effect sizes (e.g., correlations, odds-ratios, d values) across a population of studies, but other goals of meta-analysis are much broader than that: describing overall trends in a body of research, developing and testing theories, and informing practical applications (Hunter & Schmidt, 1996; Murphy, 1997).
Several approaches to meta-analysis have been proposed (e.g., Hunter & Schmidt, 1990; Hedges & Olkin, 1985; Raju, Burke, Normand & Langlois, 1991). Although these approaches differ in the specific techniques they employ, each technique involves the general goal of research integration. Perhaps the most commonly used technique in the areas of organizational behavior and industrial/organizational psychology is the technique developed by Hunter and Schmidt (Schmidt & Hunter, 1977; Hunter, Schmidt, Jackson, 1982; Hunter & Schmidt, 1990). Generally, the purpose of this method of meta-analysis is to estimate population parameters across studies (Bangert-Drowns, 1986). This is accomplished by computing average study-level effect sizes and the variance of these effect size estimates. In addition, to the extent possible, these study-level effect sizes are corrected for potential sources of error such as sampling error, range restriction, and unreliability of independent and dependent variables. The mean of these corrected effect sizes then provides an estimate of the population treatment effect. The variance of these corrected effect sizes (along with estimates of variance due to study artifacts such as sampling error) likewise provides an estimate of true variance in effect sizes. This estimate can then be used to determine whether the study-level effect sizes come from a single population or whether the effects sizes might reflect more than one population (i.e., whether there is nontrivial variance in effects sizes). If the variance in effect sizes indicates the presence of true variance, it may then be possible to identify moderators of the effect.
When correcting effect sizes for error due to statistical artifacts, it is desirable to have information regarding these artifacts for all studies included in the meta-analysis. In this fortunate case, we correct each study individually for its artifacts. If we do not have the complete artifactual information for all of the studies included in our meta-analysis, we can use a method of Hunter and Schmidt’s (1990) meta-analytic procedure that generalizes those artifacts that we do have to studies in the analysis that do not report statistical artifacts.
Meta-Analysis of Individually Corrected Correlations
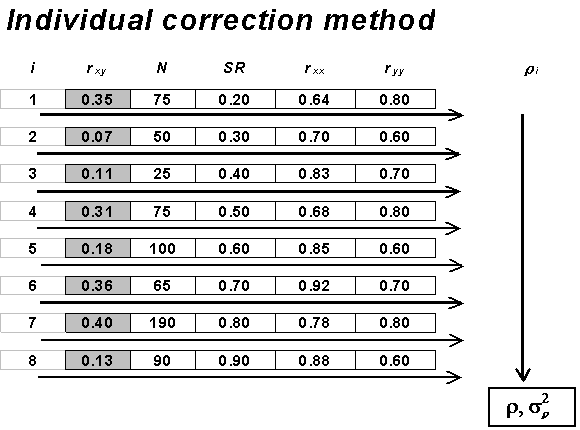
As mentioned, it is ideal case when each study going into a meta-analysis provides information about artifacts that affect the size of its correlation coefficients (or whatever effects the meta-analysis is summarizing across studies). Several types of study artifacts affect – either systematically or randomly – the size of an observed correlation obtained from an individual study (see Table 1). We can attempt to correct for the effects of most of these artifacts on individual correlation coefficients using meta-analytic methods when information about these artifacts is given for each study. Figure 1 demonstrates, conceptually, how the individual correction method estimates population means and variances. This method corrects each observed correlation coefficient with its corresponding artifact information. The mean and variance of these corrected coefficients are then computed and interpreted as estimates of the population mean and variance. Thus, the individual correction method corrects for artifacts first, and then calculates means and variances.
Meta-Analysis of Correlations using Artifact Distributions
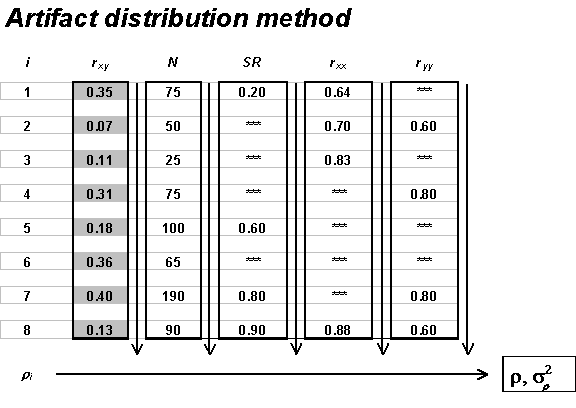
While an individual correction method can be applied in studies containing all required artifactual information for every study, this is rarely, if ever, the case in practice (Raju, Burke, Normand, & Langlois, 1991). Many studies will often not report all (or sometimes any) statistical artifacts, and at the same time one would not want to discard all such studies in a meta-analysis, as those studies still provide informative data. Hunter and Schmidt (1990) offer a solution to this practical problem, a meta-analysis method that we call the artifact distribution method. In this method, all artifacts that studies report are accumulated into a distribution (i.e., mean and variance) that corrects the distribution of observed correlations in the full sample of studies – even those studies that reported no artifacts or a partial list of artifacts (see Figure 2). Thus, this method calculates means and variances first, and then corrects for artifacts.
To reiterate, the artifact distribution method corrects distributions of observed validity coefficients with distributions of statistical artifacts, rather than correcting individual validity coefficients by their respective artifacts (Hunter & Schmidt, 1990). It is clear that, if one possesses all of the required artifact information for each study, the individual correction method is preferable. But as we have stated, this is practically never the case. Finally, it should be noted that these two methods correct for sampling error in the same manner; they differ only in how they correct for other artifacts (such as unreliability and range restriction)1. However, it is clear that these methods differ substantially in how they deal with these other artifacts
So, just how far removed from ideal is the artifact distribution method? By pairing each coefficient with its artifact information in the individual correction method, we are able to ensure the appropriate corrections are made. This is not possible with the artifact distribution method. Rather, because artifact information is not paired with each coefficient, this method's artifact corrections may yield inaccurate estimates of population means and/or variances. Specifically, in order for the artifact distribution method to yield appropriate corrections, two assumptions must be met: that artifact parameters are independent of the observed correlation coefficient and independent of one other. If these assumptions hold, Hunter and Schmidt (1990 p. 159) claim that one may generalize the mean and standard deviation of provided artifacts to those studies for which artifactual information is not provided.
These assumptions are not only required conceptually, but also computationally. To illustrate, the individual correction method estimates the population correlation coefficient as Equation 1:
![]() (1)
(1)
where r is the individual study correlation coefficient and A is the combination of artifact information obtained from that study.
On the other hand, the artifact distribution method estimates the population correlation coefficient as Equation 2:
![]() (2)
(2)
where E(r) is the mean correlation coefficient across all studies in the meta-analysis and E(A) is the mean compound attenuation factor (obtained from the studies that reported relevant artifact information). Thus, in the artifact distribution method of correction, the corrected “true” population correlation is a multiplicative function of the population correlation and the statistical artifacts, as seen in Equation 3:
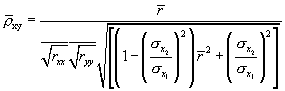 (3)
(3)
These two assumptions are necessary because if two products are independent, then the average product is the product of the averages (Hunter & Schmidt, 1990, pp. 161-162), and the results of Equation 1 equal the results of Equation 2. Accordingly, given the independence assumption, we can correct the average correlation with the average attenuation factor. But, as noted, this is dependent on the products’ covariance equaling zero.
The artifact distribution method can be advantageous in that all study data collected can be used, but it is problematic when we have any substantial amount of sampling error in artifacts (e.g., finding non-independence in the artifact distributions for our sample of studies). Given that meta-analysis is championed as a way to address individual study sampling error, this problem is worthy of concern.
Non-independence of Artifacts
One point of this paper is to point out that artifacts will not be perfectly uncorrelated in the sample of studies being meta-analyzed. There are conceptual reasons to suspect that artifacts such as range restriction and criterion reliability might be correlated (e.g., James, Demaree, Mulaik, & Ladd, 1992), but that aside, even when uncorrelated in an infinite population there will be sampling error in the sample of studies meta-analyzed that yield a non-zero correlation between artifacts. Thus, there is bound to be some error when correcting for artifactual variance based on these assumptions.
In sum, the individual correction method is used when all relevant artifact information is available and involves pairing each study correlation with its artifact information. The artifact distribution method is used when all the relevant artifact information is not available, and thus does not involve pairing each study correlation with this information, but rather involves using average artifact information (computed from those studies that do include this information) to correct correlation coefficients. These two methods will yield similar results when the artifact parameters are independent of the observed correlation coefficient and independent of one other. However, when these assumptions are violated (whether due to substantive relationships or sampling error), these methods may produce substantially different estimates of population means and variances.
Implications for Making Judgments About Validity Generalization
To understand the relationship
between variables of interest, it is crucial that meta-analysis accurately
estimates both the mean and variance of correlations across studies after
correcting for statistical artifacts.
Estimates of the population mean have been reported as being relatively
stable across different methods of computation (Cornwell & Ladd, 1993). Estimates of the population variance,
however, have been found to be much less stable, whether population variance is
measured through tests of homogeneity or estimates of true variance (Cornwell
& Ladd, 1993; Oswald & Johnson, 1998).
The size of the estimated true variance is the focus of this study, because it is this estimate that indicates whether the mean is an estimate of a single population correlation, or whether the mean is just the correlation value that study population correlations tend to estimate. In other words, the true variance estimate from a meta-analysis informs us abou the extent to which validities generalize.
Hunter and Schmidt methods of meta-analysis estimate true variance in correlations by subtracting variance attributable to study design artifacts from the variance in observed correlations. Hunter and Schmidt (1990) have proposed the 75% rule for interpreting the size of true variance estimates. This is a rule-of-thumb that essentially states that we can conclude that no meaningful true variance exists in cases where known and correctable artifacts account for at least 75% of the variance in obtained correlations (because the remaining artifacts that cannot be corrected for are likely to account for the remaining 25%). When the true variance is zero or is discounted as trivial, then the mean actual correlation is interpreted as an estimate of one overall population correlation; obtained study correlations deviate from this value only because of study design artifacts.
However, in cases where nontrivial amounts of variance still exist after artifact variance has been removed, meta-analysts usually conclude that true variance does exist, suggesting the existence of nontrivial moderator effects imparting substantive effects on the variance of correlations across studies. Thus, in this case, the mean actual correlation is not interpreted as the one true population correlation. Instead, it is interpreted as the mean of two or more populations of correlations, where populations differ on some moderators (known or unknown, unique or shared across studies).
Thus, it is clear that estimates of true variance have important implications for how meta-analyzed relationships are interpreted (e.g., these estimates determine whether validity generalization is supported or not). The accuracy of these estimates determines the appropriateness of conclusions drawn from meta-analytic studies, and therefore should be an important consideration. This study examines the accuracy of population variance estimates as well as population mean estimates resulting from Hunter and Schmidt’s individual correction and artifact distribution methods. Of particular interest is the accuracy of the true variance estimate resulting from the artifact distribution method, an estimate that is often used to draw conclusions regarding validity generalization.
Method
We
developed data to compare results from the individual correction and artifact
distribution methods using two steps.
First, Monte Carlo simulations generated in SAS/IML produced study-level
data. Second, these data were
meta-analyzed using both the individual correction and artifact distribution
method.
Simulation Specifications: Across Conditions
Crossing the levels of five aspects of the simulation created forty-two conditions. Results for each of these conditions were replicated 2,500 times.
Population correlation. The underlying population correlation r was set to one of two values: 0.25 or 0.50.
True variance. The true variance around
the overall population correlation was set to one of four values: 0, 0.00125,
0.005, or 0.02. Values were chosen to
represent four situations: no true variance, small true variance, medium true
variance, and large true variance, respectively. These are sensible values, because, for example if r was
.3, then the expected range for 95% of the studies’ true correlations would be
.3 (no range of values) for zero true variance, .23-.37 for small true
variance, .16-.44 for medium true variance, and .01-.58 for large true
variance.
Type of Distribution. Underlying distributions were
set to be either normal, unimodal, or bimodal.
The ‘normal’ distribution is not a continuous distribution but rather a
three-point triangular distribution where 50% of studies are at the mode, 25%
of studies are above the mode, and 25% are below the mode. Distances from the mode were symmetric and
set so that the true variance constraints for the particular simulation was
satisfied.
Number of Studies per
Meta-analysis. The number of studies per meta-analysis was set to one of three values:
10, 25, or 50.
Missing Data. Each meta-analysis involved either full artifact
information or missing artifact information.
In the full artifact information conditions, each study correlation was
paired with its own artifact information (predictor and criterion reliability,
range restriction). In the missing
artifact information conditions, 60% of the studies containing all artifact
information were selected at random, and then out of those studies 35% of the
artifact information was randomly set to missing. This means that studies selected to have their artifact data set
to missing could end up with zero, one, two, or all three pieces of artifact
information missing. Overall our method
of deleting artifact information means that we expect complete artifact information
in 56% of the studies 27% with one piece missing, 14% with two pieces missing,
and 3% with all three pieces missing.
Simulation Specifications: Within Conditions
Please refer to Table 2 for details on specifications within each simulation.
Meta-analyzing Simulated Data: Individual Correction Method
Data resulting from each of these conditions were meta-analyzed using both the individual correction and artifact distribution method. For the individual correction method, in the meta-analyses on studies with no missing data, each observed correlation was corrected by its corresponding artifact information. Means and variances of these corrected correlations were then computed using the Hunter and Schmidt (1990) method of meta-analysis. In meta-analyses on studies with missing-data, only each observed study correlation with full artifact information was corrected by its corresponding artifact information, and studies with missing information were not meta-analyzed. Means and variances of these corrected correlations were then computed in a similar manner as above.
Meta-analyzing Simulated Data: Artifact Distribution Method
The same data analyzed with the individual correction method were also analyzed by applying the artifact distribution method. For meta-analyses on studies with no missing data, the full distributions of artifact information were used to correct the mean and variance of observed correlations using the Hunter and Schmidt method using artifact distributions. In the missing-data condition, the distributions of available artifact information were used to correct the mean and variance of observed correlations.
Thus, for the artifact distribution method, the only difference between meta-analyses with no missing data conditions and the meta-analyses with missing data is the number of pieces of artifact information in the artifact distributions; in the no-missing-data condition the artifact distributions are based on the full set of artifact information for each study, whereas in the missing-data condition the artifact distributions are based on only a partial set of artifact information. These two conditions do not differ in the number of studies meta-analyzed. By contrast, for the individual correction method, the number of studies meta-analyzed does differ between the no-missing-data and missing-data conditions. Whereas in the no-missing-data condition all of the available studies are meta-analyzed, in the missing-data condition only those studies with full artifact information are meta-analyzed.
Results
Descriptive statistics for all of the conditions run in the current simulation are presented in Tables 3 through 5. For eight selected conditions, we report additional summary data in order to better illustrate the differences between the AD and IC methods (see Table 6). The eight conditions represent all possible combinations that contain medium and zero true variance and ρ = .50 and 25 studies per meta-analysis. While general trends can be observed by viewing Tables 2 through 5, the reported results are focused on the selected conditions.
In the ![]() = 0 condition with no
missing data (and ρ = .50, k=25), the mean variance of ρ
calculated with the IC method is -.0041 while the mean
= 0 condition with no
missing data (and ρ = .50, k=25), the mean variance of ρ
calculated with the IC method is -.0041 while the mean ![]() calculated with the
AD method is .0210. Thus, in this case
the IC method is slightly negatively biased while the mean of the AD method
falls at what we consider to be a large amount of variance and thus is
considerably positively biased. The
means in the missing data condition are virtually identical to those in the
non-missing data condition (Table 6).
calculated with the
AD method is .0210. Thus, in this case
the IC method is slightly negatively biased while the mean of the AD method
falls at what we consider to be a large amount of variance and thus is
considerably positively biased. The
means in the missing data condition are virtually identical to those in the
non-missing data condition (Table 6).
Mean differences aside, one might expect to find
greater variability in the missing data condition. As might be expected, the missing data condition resulted in
increased variability when the estimate of ![]() is calculated using
the IC method. Within the IC method,
the difference in SD between the missing and non-missing data conditions is
.0021, mid-way between a medium and small amount of variance. By contrast, the same difference within the
AD method was a trivial .0008.
Presumably, this is because the AD method utilizes means for artifact
corrections versus individual study-level data, and means tend to be more
stable (if not biased).
is calculated using
the IC method. Within the IC method,
the difference in SD between the missing and non-missing data conditions is
.0021, mid-way between a medium and small amount of variance. By contrast, the same difference within the
AD method was a trivial .0008.
Presumably, this is because the AD method utilizes means for artifact
corrections versus individual study-level data, and means tend to be more
stable (if not biased).
In the medium true variance condition, with no
missing data, the mean ![]() estimate calculated
with the IC method is -0.0006, while it is .0262 with the AD method. Thus, where we would expect to find medium
true variance, the IC method provides a negatively biased estimate whose mean
approximates zero, and the AD method is biased toward finding a large amount of
variance. Both tendencies are
inaccurate and in different directions.
estimate calculated
with the IC method is -0.0006, while it is .0262 with the AD method. Thus, where we would expect to find medium
true variance, the IC method provides a negatively biased estimate whose mean
approximates zero, and the AD method is biased toward finding a large amount of
variance. Both tendencies are
inaccurate and in different directions.
In comparing the difference in the SD of the estimated
![]() between the missing
and non-missing data conditions within the medium true variance condition, the
data parallel the results previously discussed for the no true variance
condition. Specifically, the difference
between missing and non-missing data conditions for the IC method is .002,
while the same difference for the AD method is a trivial .0003.
between the missing
and non-missing data conditions within the medium true variance condition, the
data parallel the results previously discussed for the no true variance
condition. Specifically, the difference
between missing and non-missing data conditions for the IC method is .002,
while the same difference for the AD method is a trivial .0003.
Another way to look at the difference between the
two methods is to compare percentages of values of our estimates of ![]() obtained for
the two conditions across intervals based on our designations of zero (.000),
small (.00125), medium (.005), and large (.02) amounts of true variance.
obtained for
the two conditions across intervals based on our designations of zero (.000),
small (.00125), medium (.005), and large (.02) amounts of true variance.
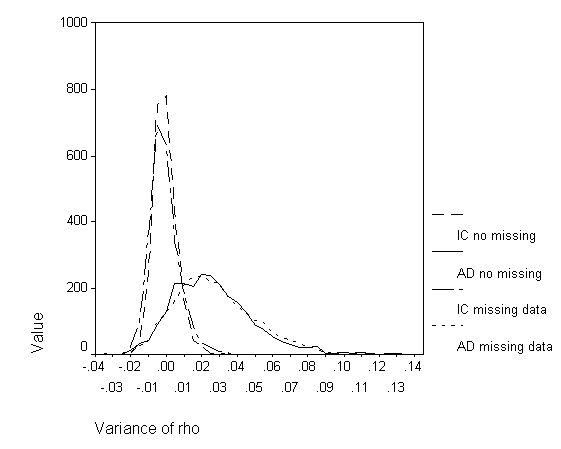
Examining the situation where the true variance is zero, positive bias in the AD method is again observed. For the IC method, 84.48% of cases had a variance smaller than .00125. For the AD method, however, the percentage is a much-reduced 17.64%. In other words, where there should have been no variance, the AD method resulted in greater than a small amount of variance in 82.36% of the cases. The missing data condition resulted in nearly identical results (see Table 6).
With a population variance of .005, we expect approximately 50% of the cases to fall on either side of .005. With no missing data, the IC method is negatively biased with 82.68% of cases having a variance of less than .005. However, the AD method for the same data resulted in only 16.56% of cases having a variance of less than .005, exhibiting a positive bias. In fact, for the AD method, 72.72% of cases (versus .52% for the IC method) had a variance greater than .02, the indicator used for large variance. The inclusion of cases with missing data results in the similar pattern of findings, which can be seen in Table 6. The exception is a reduced percentage of cases being above the large variance indicator for the AD method (58.6% compared to 72.72%).
The trends described above are perhaps better illustrated graphically. Figures 3 and 4 present the simulation data as grouped-frequency line graphs. Figure 3 allows for the comparison of the IC and AD methods, both with and without missing data, for the no true variance condition. The distributional shapes of the missing and non-missing data conditions are quite similar. However, the IC and AD method distributions exhibit pronounced differences. The slight negative bias of the IC method and the substantial positive bias of the AD method is readily observed, as well as the AD method’s greater variability. Figure 4 allows for the same comparisons in the medium variance condition and evidences the same trends observed in the no true variance conditions. In fact, a comparison of mean variance difference reveals that the distributions shift by approximately the same amount as the increase in variance. However, this shift results in a slightly more negatively biased estimate for the IC method for both missing and non-missing data conditions (.0016 and .0013, respectively) and an equally positively biased estimate for the AD method in the missing data condition only (.0013). The change in bias for the non-missing data condition is negligible (.0002).
Discussion
The data suggest several important trends in the estimation of
population variance. First, estimates
of ![]() are
consistently negatively biased when the individual correction method is
employed. For each condition, the mean
are
consistently negatively biased when the individual correction method is
employed. For each condition, the mean ![]() value obtained with
the IC method was less than the true variance.
Second, in each condition, the mean
value obtained with
the IC method was less than the true variance.
Second, in each condition, the mean ![]() obtained with the AD
method was greater than the true variance.
Third, in the missing data conditions, a slight increase in the
variability of
obtained with the AD
method was greater than the true variance.
Third, in the missing data conditions, a slight increase in the
variability of ![]() was observed for the
IC method, but not for the AD method.
However, as the figures clearly illustrate, this increase is
insubstantial in comparison to the variability in
was observed for the
IC method, but not for the AD method.
However, as the figures clearly illustrate, this increase is
insubstantial in comparison to the variability in ![]() computed with the AD
method in both missing and non-missing data conditions.
computed with the AD
method in both missing and non-missing data conditions.
Implications
for detecting moderators
We look to the population variance estimate to determine the existence
of moderators in a meta-analysis, which clearly has implications for validity
generalization conclusions and the research, practice, and policy decisions
that stem from such conclusions. The results of this study caution us not
to rely solely on this estimate – in general but especially when one has to
rely on the popular artifact distribution method Hunter and Schmidt
offer. The true variance estimates have a bias for which we may be able
to correct, but this would not seem to help much given
the massive amounts of variability in the estimate of ![]() . In other words, even though you might
be able to correct true variance estimates so they are accurate on average, it
is likely that the true variance estimates in your particular meta-analysis are
far enough away from the average result to make any bias correction
hopeless. Even taking the bias into account, we still cannot be sure that
our estimate really reflects the variance of the true population.
. In other words, even though you might
be able to correct true variance estimates so they are accurate on average, it
is likely that the true variance estimates in your particular meta-analysis are
far enough away from the average result to make any bias correction
hopeless. Even taking the bias into account, we still cannot be sure that
our estimate really reflects the variance of the true population.
Limitations
and future research
One limitation of this study is that we do not address hybrid methods that can incorporate elements of both the IC and AD method (e.g., see a sketch of such a method in Hunter & Schmidt, 1990). Clearly these methods may offer some advantage, and may be a mid-point between the methods described here. However, the cautioning message regarding the use of methods based on the IC and AD method in decisions based on the validity generalization of psychological constructs still applies, as they are still incorporated, just in mixed degrees, in the analyses.
Another limitation is that we used a
fixed level of missing data. It is
possible that different conclusions might be drawn if different percentages of
missing data were used. If taken to the
extreme, there clearly must be some point at which the exclusion of valid cases
to be used in the IC method would result in greater variability of ![]() than with the
AD method. This is an empirical
question that should be addressed in future research.
than with the
AD method. This is an empirical
question that should be addressed in future research.
Conclusion
In sum, the results of this study urge us to use caution when interpreting estimates of population variance. We should not let our estimate dictate our decisions regarding moderators, particularly if we have theoretical reasons to question such estimates. As with any other type of research, we should use good theory to properly inform the interpretation of our data.
References
Bangert-Drowns, R. L. (1986). Review of developments in meta-analytic method. Psychological Bulletin, 99, 388-399.
Cornwell, J. M., & Ladd, R. T. (1993). Power and accuracy of the Schmidt and Hunter meta-analytic procedures. Educational and Psychological Measurement, 53, 877-895.
Hedges, L. V., & Olkin, I. (1985). Statistical methods for meta-analysis. New York: Academic Press.
Hunter, J. E., & Schmidt, F. L. (1990). Methods of meta-analysis: Correcting error and bias in research findings. Newbury Park: Sage.
Hunter, J. E., & Schmidt, F. L. (1996). Cumulative research knowledge and social policy formulation: The critical role of meta-analysis. Psychology, Public Policy, & Law, 2, 324-347.
Hunter, J. E., Schmidt, F. L., & Jackson, G. B. (1982). Meta-analysis: Cumulating research findings across studies. Beverly Hills, CA: Sage.
James, L. R., Demaree, R. G., Mulaik, S. A., & Ladd, R. T. (1992). Validity generalization in the context of situational models. Journal of Applied Psychology, 77, 3-14.
Johnson, B. T., Mullen, B., & Salas, E. (1995). Comparison of three major meta-analytic approaches. Journal of Applied Psychology, 80, 94-106.
Koslowsky, M., & Sagie, A. (1994). Components of artifactual variance in meta-analytic research. Personnel Psychology, 47, 561-574.
Murphy, K. R. (1997). Meta-analysis and validity generalization. In N. Anderson & P. Herriot (Eds.), International handbook of selection and assessment (pp. 323-342). New York: Wiley.
Oswald, F. L., & McCloy, R. A. (in press). Meta-analysis and the art of the average. In Validity generalization: A critical review. Mahwah, NJ: Erlbaum.
Raju, N. S., Burke, M. J., Normand, J., & Langlois, G. M. (1991). A new meta-analytic approach. Journal of Applied Psychology, 76, 432-446.
Schmidt, F. L., & Hunter, J. E. (1977). Development of a general solution to the problem of validity generalization. Journal of Applied Psychology, 62, 529-540.
Footnote
1 The correction for sampling error variance is a direct function of the mean correlation between predictor and criterion as well as the mean sample size of the studies included in the analysis. As all studies have this information, this correction is based on all studies to be meta-analyzed—whether using the individual correction or artifact distribution method.