DHML
DHM: Digital Holographic Microscopy
line decor
  
line decor


C. Mann, L. Yu, & M.K. Kim, “Movies of cellular and sub-cellular motion by digital holographic microscopy”, Biomed. Engg. Online, 5, 21 (2006). > pdf

Many biological specimens, such as living cells and their intracellular components, often exhibit very little amplitude contrast, making it difficult for conventional bright field microscopes to distinguish them from their surroundings. To overcome this problem phase contrast techniques such as Zernike, Normalski and dark-field have been developed to improve specimen visibility without chemically or physically altering them by the process of staining. These techniques have proven to be an invaluable tool for studying living cells and furthering scientific understanding of fundamental cellular processes such as mitosis. However a drawback of these techniques is that direct quantitative phase imaging is not possible. Quantitative phase imaging is important because it enables determination of the refractive index/optical thickness variations with sub-wavelength accuracy. Digital holography is an emergent phase contrast technique that offers an excellent approach to accurate and quantitative phase imaging. A CCD camera is used to record a hologram onto a computer and numerical methods are subsequently applied to reconstruct the hologram to enable direct access to both phase and amplitude information. Another attractive feature of digital holography is the ability to focus on multiple focal planes from a single hologram, emulating the focusing control of a conventional microscope.

[QuickTime 2.6MB] Twelve-hour time lapse movie of fibroblast cells undergoing mitosis, obtained by digital holographic microscopy. The pseudocolor 3D rendering represents optical thickness profile of the cell.


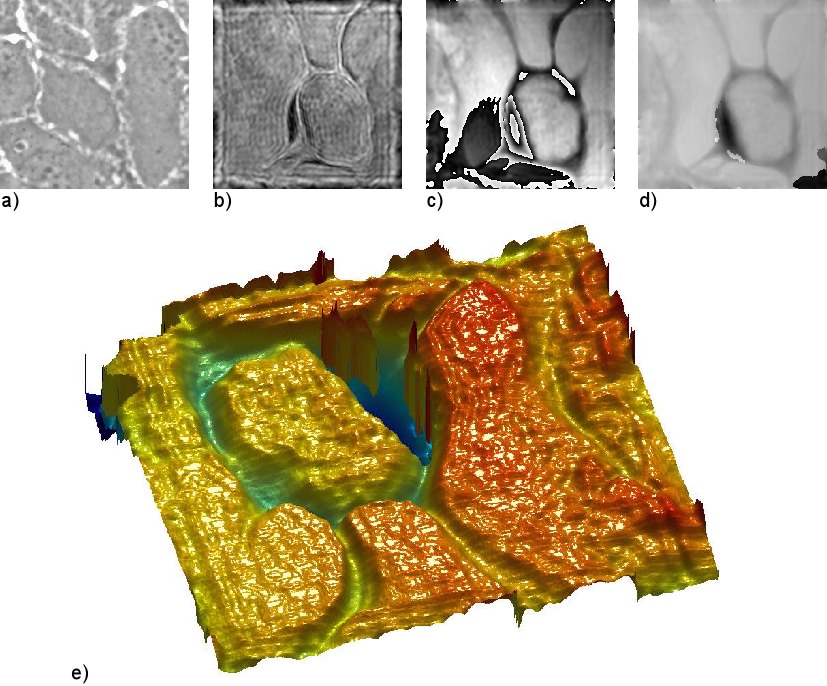
C.J. Mann, L. Yu, C.M. Lo, & M.K. Kim, “High-resolution quantitative phase-contrast microscopy by digital holography”, Opt. Express 13, 8693-8698 (2005). (An image from this paper was featured on the masthead of the issue.)  > pdf

Techniques of digital holography are improved in order to obtain high resolution, high-fidelity images of quantitative phase-contrast microscopy. In particular, the angular spectrum method of calculating holographic optical field is seen to have significant advantages including tight control of spurious noise components. Holographic phase images are obtained with 0.5 µm diffraction-limited lateral resolution and largely immune from the coherent noise common in other holographic techniques. The phase profile is accurate to about 30 nm of optical thickness. Images of SKOV-3 ovarian cancer cells display intracellular and intranuclear organelles with clarity and quantitative accuracy.

Holography of non-confluent SKOV-3 cells. The image area is 60 x 60 µm2 (404 x 404 pixels) and the image is at z = 5 µm from the hologram: (a) Zernike phase contrast image; (b) holographic amplitude and (c) phase images; (d) unwrapped phase image; (e) 3D pseudocolor rendering of (d).

Holography of confluent SKOV-3 ovarian cancer cells. The image area is 60 x 60µm2 (404 x 404 pixels) and the image is at z = 10 µm from the hologram: (a) Zernike phase contrast image; (b) holographic amplitude and (c) phase images; (d) unwrapped phase image; (e) 3D pseudocolor rendering of (d).


C. Mann, L. Yu, & M.K. Kim, “Movies of cellular and sub-cellular motion by digital holographic microscopy”, Biomed. Engg. Online, 5, 21 (2006). > pdf

Both cellular and sub-cellular features are imaged with sub-micron, diffraction-limited resolution. Movies of holographic amplitude and phase images of living microbial cells are created from a series of holograms recorded at 20 frames per second and reconstructed with numerically adjustable focus, so that the rapidly moving microbes can be accurately tracked. The holographic movies show the organisms swimming among other microbes as well as displaying some of their intracellular processes.

..

[QuickTime 1.2MB] 4-Numerical focusing in digital holography of paramecia from a single hologram. Video sequence of a) 90 x 90 µm2 area (432 x 432 pixels with z scanned from 50 to 250 µm in steps of 10 µm. b) 250 x 250µm2 (464 x 464 pixels) with z scanned from 0 to 1000 µm in steps of 50 µm.

[QuickTime 2.7MB, 2.0MB] Holographic movies of a rotifer, showing a) amplitude and b) phase movies of area 70 x 70 µm2 (360 x 360 pixels) with z = 79~80 µm.