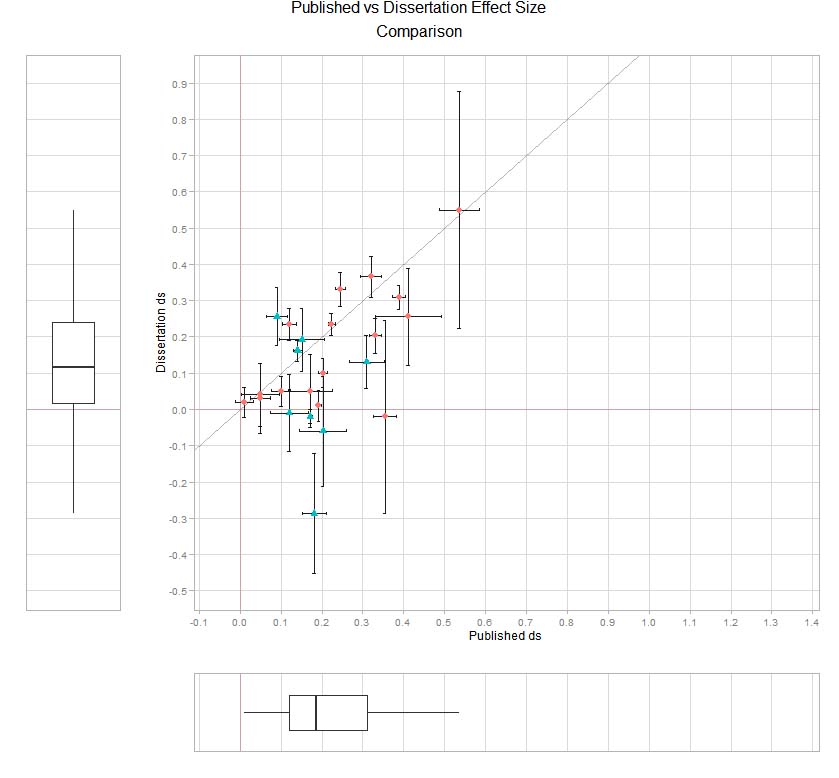
Crosshairs. Brannick & Gultas, 2016, Research Synthesis Methods. This graph is a meta-analytic scatterplot that can display whiskers, boxplots, and simple descriptive statistics.
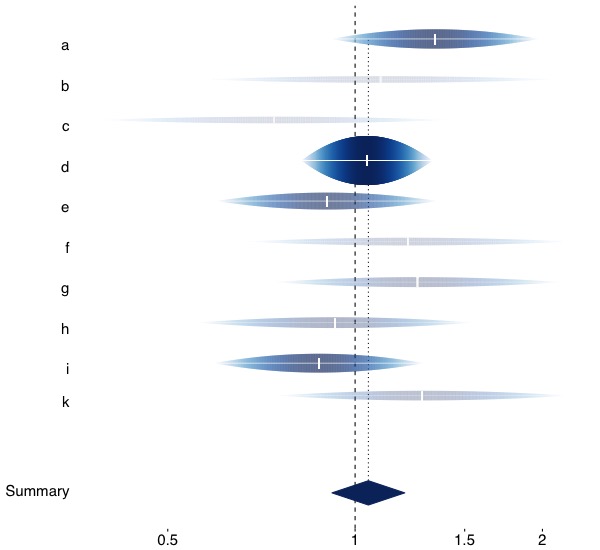
Rainforest. Schild, A. H. E., & Voracek, M. (2014). Finding your way out of the forst without a trail of bread crumbs: development and evaluation of two novel displays of forest plots. Research Synthesis Methods, 6, 74-86. This graph is a forest plot, but the plot symbol is shaded to approximate the density of the distribution so that more likely areas are darker. I planned to help you use this, but it's harder than I thought. I think you need to know ggplot before you can use it. You can download their program in R here or at the RSM website. My server won't let me share files with the extension 'R' so I've added the extension .txt that you have to remove before execuation. R program: Rainforest.
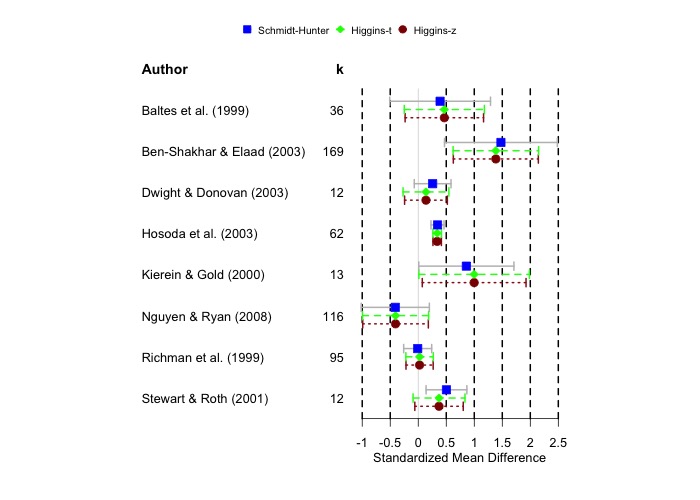
R program forestplot. Data in Excel Spreadsheet. Video. This freestanding program has some nice features that make it easy to do some things that are hard to do in metafor, such as pair plot symbols.