Part 1: Basics
This section deals with topics that are universal to statistics. It also contains instruction on the basics of the R software.
Statistical Jargon
This module describes such concepts as: Population vs. Sample, Parameter vs. Statistic, Descriptive vs. Inferential statistics, Random selection (sampling) and assignment, Internal and External validity of experiments, Discrete vs. continuous variables, and Scale types (nominal, ordinal, interval, ratio).
You will find both PowerPoint slides and html files, but no computations for this module.
Central Tendency and Variability
Here you will find descriptions of central tendencey (mean, median, mode) and variability (range, variance, standard deviation), and brief thoughts about the pros and cons of each. This is review for most graduate students. You will also be reminded of the z score.
PowerPoint file for central tendency and variability.
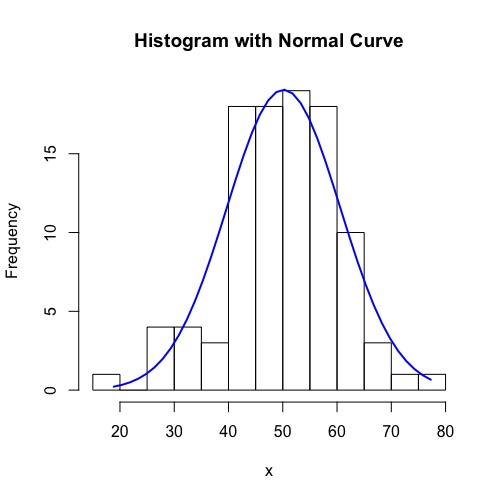
Data Distributions and Graphs
Here you will find the introduction to R for descriptive statistics. R has lots of packages (programs) that will compute these. I use the package 'psych' for computing descriptive statistics. In this module, I also use the package 'car' to illustrate some badly skewed data. You'll find examples of histograms, boxplots, and stem-leaf diagrams for portraying data distributions.
Powerpoint slides. R code for distribution graphs and explanation. Some R code and notes about cleaning data before you analyze.
Normal Distribution
Psychologists make use of the normal distribution quite a bit. In this module, you'll find the math description of the bell cure, learn about finding areas under the curve and solve problems requiring you to use data to estimate means, standard deviations, and probabilities.
PowerPoint slides. Narrative description of the normal and description of R code regarding the normal distribution. Exercise using R and the Davis dataset. Solution to the exercise.
Sampling Distribtuions
A simpliefied definition of sampling distribution is the distribution of a statistic computed on many different samples. It is a surprisingly difficult concept to master, I think because it is abstract and requires multiple steps to create. You'll see a definition and some examples of sampling distributions. The sampling distribution is fundamental to statistical tests of parameter estimates. In most applications of statistics, we collect data to estimate some quantity such as a popululation mean, and then indicate our uncertainty about the actual value with a confidence interval. The sampling distribution is the basis of the mathematical justification for the way we compute the estimate and its confidence interval. So you'll also see some ideas about how to know if our parameter estimates are good, including bias and the principle of maximum likelihood. Then we will actually compute an estimate and it's confidence interval. Finally, we'll take a look at the Central Limit Theorm, which justifies the use of the normal distribution in many applications.
PowerPoint slides. Videos of the slideshow with voiceover on Youtube (in four pieces - 1, 2, 3, 4). R code illustation of the Central Limit Theorem.
Hypothesis Testing
The classical approach to statistical tests - null hypothesis statistical testing - is one of the two most difficult concepts in this class (the other is partial correlation). But it's like riding a bicycle: at first you fall off and skin your knee, but after you get it, it's hard to recall why it was difficult in the first place and you never forget it. In this module we will start with a bit of historical and philosophical context for hypothesis testing, and then describe statistical hypotheses (the null hypothesis and the alternative hypothesis). Next we walk through the typical steps or process of conducting a statistical test. We work a problem using heights of men and women. Then we discuss Type I and Type II errors in statistical tests. We conclude with the concept of statistical power, why you want it, and what you can do to get it for your study.
PowerPoint slides. Narrative description of hypothesis testing parallel to the slides. R code for Davis problem.
Binomial Distribution & Bayes' Theorem
There is a slideshow that describes the binomial, including combinations and permutations. There is a brief introduction to Bayes' Theorem as an additional perspective on NHST and revision of belief.
PowerPoint slides.
Chi-square and F Distributions
I call these distributions 'the children of the normal.' Chi-square and F are theoretical (mathemtatically defined) distributions that are related to the normal distribution. You will see how they are related in this module. Both distributions are related to the variance and both are used in computing statistical tests. Chi-square is often used in testing hypotheses about frequencies, but it can also be used to set a confidence interval about an estimated population variance. The F distribuiton is used in a large number of statistical tests, including significance tests in analysis of variance and in regression.
PowerPoint slides. R code for chi-square. Video voiceover for chi-square. R code for F. Video voiceover for F. Excel program to test variances with chi-square and F.